
1. Introduction
I acknowledge the Ngunnawal custodians of this land, pay respects to their elders, and commit myself to the full implementation of the Uluru Statement from the Heart.
For a man I never got to meet, Fred Gruen had a remarkably large impact on my life. As a university student, his book with Michelle Grattan, Managing Government: Labor's Achievements and Failures, shaped how I thought about the economic impact of the Hawke and Keating governments. I wrote my honours thesis on Labor’s unilateral tariff cuts in 1973, 1988 and 1991, and why a social democratic government chose free trade when many other left‑wing governments favoured protectionism. I concluded that part of the answer lay in the power of ideas. Gough Whitlam’s 25 per cent tariff cut in 1973 might not have happened without the persuasive impact of Fred and other economists. Economic ideas matter. As John Maynard Keynes put it, ‘the world is ruled by little else’.
But it almost didn’t happen. Born in Vienna in 1921, Fred Gruen was sent to Australia on a ship called the Dunera in 1940. Two days after departing Liverpool, the boat was struck by a German torpedo, which did not explode. As Bruce Chapman once observed, Australia benefited greatly from the incompetent German torpedo maker, whose failure enabled the success of the ‘Dunera Boys’.
Initially, Fred Gruen bought a farm in Melbourne, and taught agricultural economics at Monash. He said in the early years at Monash that he was ‘one lecture ahead of the students and one fence ahead of the cattle’. His research showed a passion for equality as well as efficiency, and this came out in how he conducted himself. In the 1960s, Monash University did not allow several honours students working as research assistants to enter the staff tearoom. In protest, Fred and a few other professors refused to use the tearoom until the research assistants were admitted too.
In 1971 he accepted a professorship at the Research School of Social Sciences at the Australian National University, and served as the head of Economics RSSS from 1972 to 1986. He helped shape Economics RSSS into a research and policy powerhouse. David Gruen said of his father ‘Dad made economics interesting, immediate and important.’ John Quiggin wrote a song upon Fred Gruen’s retirement, which included these verses:
I was lost in the Coombs, in a maze of empty rooms
When I came across a fine and stately ruin
I took a look to see, and it was a shock to me
When I realised that I’d stumbled on Fred Gruen.He stands out by a mile, for grace and charm and style
Whether speaking or writing or reviewing
But if your theory’s wonky, or your arguments are shonky
You’ll rue the day you ran across Fred Gruen.
Fred died in 1997, on the same day as Nugget Coombs – a coincidence that is for Australian economics the equivalent of Thomas Jefferson and John Adams passing away on 4 July 1826. When I arrived at Economics RSSS 7 years later, his legacy was still strong. The focus was on publishing in top journals, and having an impact on policy. I was the last head of Economics RSSS, which Fred had steered so ably a generation earlier.
I’ve also been greatly influenced by Fred Gruen’s sons Nicholas and David, both of whom found themselves drawn to the family profession. As a Deputy Secretary in Treasury, David even persuaded me to do a secondment to Treasury for 6 months in 2008‑2009. Little did either of us know that 13 years later, I would end up as the Assistant Minister responsible for the Australian Bureau of Statistics, headed by David. Nor that I would have a chance to work with Fred’s granddaughter Anna Gruen, a trusted adviser in the office of Treasurer Jim Chalmers.
My talk today draws on new research, using large business microdata sets to better understand the dynamics of the Australian economy, and explore the relationship between market concentration, markups and company formation. My aim is to help explain Australia’s productivity slowdown, and contribute to a debate about how we can raise productivity in the future. I hope Fred would have approved.
2. The slowdown in productivity growth
Productivity growth is the key driver of living standards over the long run. The key reason that the typical Australian worker now earns more in a day than workers earned in a week in 1901 is that today’s workers are more productive.
However, productivity growth has slowed in Australia since the mid‑2000s. Average productivity growth in the past 30 years was 1.6 per cent. Average productivity growth in the past 20 years was 1.2 per cent (average productivity growth in the past 10 years was also 1.2 per cent). The Treasurer has confirmed that the upcoming budget will no longer assume that productivity will return to its 30‑year average, but instead uses the 20‑year figure. This makes a big difference to our assumptions about the trajectory of the economy.
Slower productivity growth means lower real wages and less buying power for households. It constrains the ability of the budget to build infrastructure and help poor people here and overseas. Whether your priority is paying down debt or boosting teacher quality, you should be worried about the drop in productivity. Robert Lucas’s observation about growth holds for productivity too: once you start thinking about it, it’s hard to think of anything else.
Figure 1: Average labour productivity growth by cycle
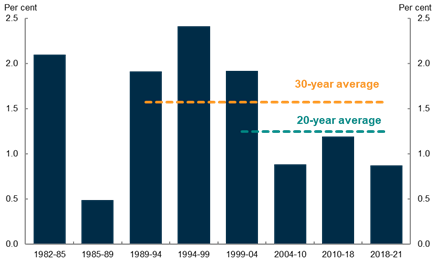
Note: The 2018‑21 cycle is incomplete.
Source: ABS Australian System of National Accounts.
3. Decreasing dynamism
The slowdown in productivity growth has been – at least in part – driven by a decline in economic dynamism. When workers switch from low‑productivity to high‑productivity firms, they earn higher wages, and the economy benefits. Yet this productivity‑boosting job switching has slowed in recent years. This alone can account for around a quarter of the slowdown in productivity growth from 2012‑2016, relative to the decade prior (Andrews and Hansell 2019).
One simple way of seeing this is to look at the decline in job mobility since the mid‑2000s. Analysing ABS Labour Force microdata, we can calculate the share of employees who started a new job each quarter. Figure 2 shows that the share of workers who started a new job in the past quarter declined from 8.7 per cent in the period from February 2002 to May 2008 to 7.3 per cent in the period from August 2008 to November 2019.
Figure 2: Workers with a new job
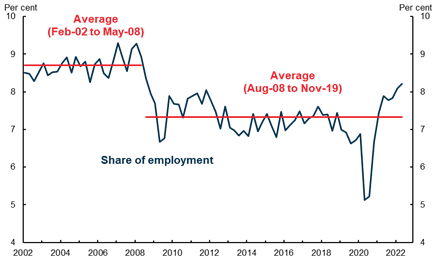
Source: Treasury analysis of ABS Labour Force microdata.
Another crucial measure of the health of an economy is the startup rate: how many new companies are being created every year? We can think of this as the business equivalent of the birth rate. Just as demographers look to the number of new people coming into the world, IO economists are interested in the new business formation rate.
In measuring new business formation, it is important to avoid counting mere changes in legal form. If an employee is asked to quit, get an ABN, and come back the next day as a contractor to do similar work, then Australia has recorded an additional ABN. But would we want to think of this as a true startup business?
One way to address this problem is to restrict the analysis to employing businesses. This then allows us to calculate the entry rate (the number of new firms divided by the total number of firms at the start of the year), and the exit rate (the number of firm closures divided by the total number of firms at the start of the year).
Figure 3 shows that the entry rate dropped from 13 per cent in 2005‑06 to 11 per cent in 2018‑19. Over the same period, the exit rate fell from 10 per cent to 8 per cent. The chart also shows the pandemic period, though it is difficult to be sure the extent to which temporary government support and changes in insolvency laws affected the trends. Nonetheless, even if we include the pandemic years, there is a clear downward trend in both lines. Among employing firms, the startup rate has slowed, and the exit rate has declined. Australian firms aren’t being created at the same pace as in years past. Our firms are getting older.
Figure 3: Firm entry and exit rates
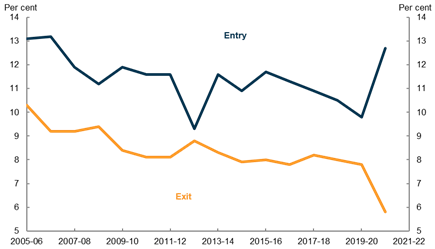
Notes: Entry and exit rates are for employing firms.
Source: ABS Counts of Australian Businesses, including Entries and Exits, by Employment Size Ranges (Table 13a).
4. Rising market power
Just as productivity depends on the creation of new enterprises, and the shift of workers to high‑productivity firms, so too competition matters. Competitive pressures encourage firms to improve quality and offer attractive prices. Competition spurs businesses to develop new products and services. Competition encourages firms to innovate in their business processes, and use their staff more effectively. In competitive industries, companies are forced to ask themselves what they need to do to win market share from their rivals. That might lead to more research and development, the importation of good ideas from overseas, or adopting clever approaches from other industries. Customers benefit from this, but so too does the whole economy. Competition creates the incentive for companies to boost productivity.
Unfortunately, the reverse is true too. Monopolists tend to charge higher prices and offer worse products and services. They might opt to cut back on research, preferring to invest in ‘moats’ to keep the competition out. If they have plenty of cash on hand, they might figure that if a rival does emerge, they can simply buy them out and maintain their market dominance. Monopoly rents lead to higher profits – and higher prices.
What do we know about market power in Australia? One way of analysing the issue is to look at industry concentration. In Leigh and Triggs (2016) we used data from the private data provider IBIS World to estimate market concentration across 481 industries at a single point in time in 2016. We found a high level of concentration, but were unable to look at whether this had worsened over time.
Here, we turn to the Business Longitudinal Analysis Data Environment (BLADE), a microdata set that contains the universe of Australian firms since 2001‑02. In each financial year, we calculate the market share of the largest four firms within each industry (excluding firms in the finance sector, as well as the non‑market sector like health and education). We also estimate the Herfindahl Index, a measure of concentration calculated as the sum of the squared market share of each firm. The Herfindahl Index ranges from zero (perfect competition) to one (a single monopolist). Industries are defined at the 4‑digit ANZSIC level. This analysis covers more than 1 million firms in each year.
In 2001‑02, the market share of the largest four firms averaged 41 per cent. By 2018‑19, this figure had risen to 43 per cent. Similarly, the Herfindahl Index increased from 0.110 in 2001‑02 to 0.113 in 2015‑16. Even without using microdata, we can see across the economy, from baby food to beer, the top firms hold a high and growing share of the market.
Moreover, this problem may be even larger if one were to take account of the fact that rival firms often have large shareholders in common. For example, the largest shareholders of the Commonwealth Bank are Vanguard and Blackrock, which are also the largest shareholders of the other three major banks in Australia (Leigh and Triggs 2021). Accounting for common ownership – for example through a modified Herfindahl index – increases measures of market concentration still further.
Figure 4: Industry Concentration
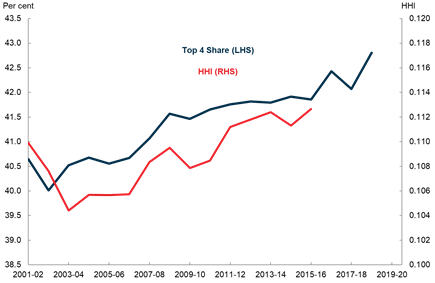
Note: Both top 4 share and HHI calculated using unweighted average of industries.
Source: Treasury calculations based on ABS BLADE data.
On their own, industry concentration metrics cannot give a full picture on competition. For example, an increase in concentration could reflect a competitive environment which forces inefficient firms out of the market. If the biggest four firms in an industry are regularly turning over, we might have high measured market concentration, but a dynamic economy nonetheless.
Incumbency metrics try to address this concern by looking at each industry in Australia and asking, of the top 4 largest firms in the industry, how many remain there for the following 2 or 4 years? This is relevant as a highly concentrated industry could still be quite competitive if there was a lot of churn among the leaders, with new firms growing and displacing the incumbents. However, it may be more concerning if the industry is concentrated among a few leaders that use their market power, rather than their productivity, to resist being dislodged.
The analysis here indeed shows that firms have become more secure in their place at the top of the pile. Of the companies that were top four in 2001‑02, 71 per cent were still there 2 years later. Among the firms that were top four in 2016‑17, 75 per cent were still there 2 years later. Likewise, among the firms that were top 4 in 2001‑02, 56 per cent were still there 4 years later. Of those firms who were top 4 in their industry in 2014‑15, 65 per cent were still there 4 years later. It’s getting sticky at the top.
Figure 5: Share of top four firms still in the top four after 2 and 4 years
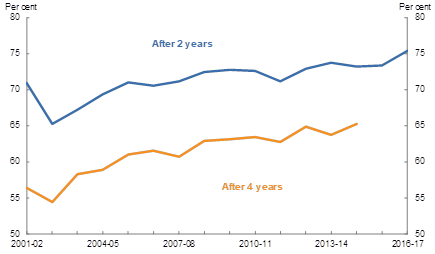
Source: Treasury calculations based on ABS BLADE data.
5. Mounting markups
What does this mean for consumers? One way to answer this question is to look at what has happened to mark‑ups. A mark‑up measures the price that a company charges for its product or service, relative to the marginal cost of production. Under perfect competition, mark‑ups should be small – reflecting only the need for business owners to make a return that compensates for their risk. Under a monopolised economy, mark‑ups might be massive.
Figure 6 draws on the work of Hambur (2021), who estimated mark‑ups in the non‑financial market sector, which captures about 60 per cent of the sales in each constituent industry division. According to these estimates, average firm markups increased by around 6 per cent between 2003‑04 and 2016‑17 (Hambur 2021). This matches the trend in other advanced economies (De Loecker et al 2020; Kouvavas et al 2021; cf Basu 2019).
Figure 6: Average Firm‑level Mark‑ups
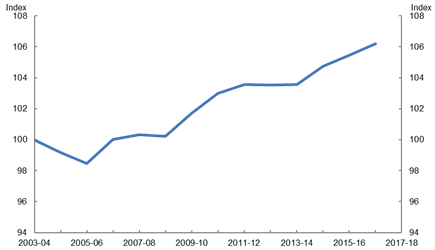
Notes: Index = 100 in 2003‑04; unweighted.Source: Hambur (2021)
As we have already mentioned, measures of concentration, incumbency and mark‑ups are not perfect measures of market power. There are several potential explanations for the rise in these metrics. Drawing on the work of Hambur (2021), we can step through three of these explanations.
The first potential explanation is that the increase in firm markups may reflect a rise in ‘superstar firms’ where the most productive firms benefit at the expense of others (Autor et al 2020). If this were the case, increasing concentration wouldn’t be as concerning, rather it would reflect resources flowing to more productive uses.
However, this explanation does not appear to be the key driver for Australia. While the increase in mark ups is larger for the upper part of the mark‑up distribution, the increase in mark‑ups is relatively broad‑based. The increase in mark‑ups has been driven by higher mark‑ups across entire sectors, and is not limited to upper‑end superstar stand‑outs.
Figure 7: Distribution of Firm‑level Mark‑ups

Note: Index 2003‑04=100; Unweighted distribution. Source: Hambur (2021)
The second potential explanation of higher mark‑ups is changing technology. Firms are increasingly focusing on intangible assets, software and other technologies that have increasing returns to scale, network effects and are more scalable. The increase in markups may therefore reflect these features of changing technology. There is some evidence for this theory. Mark ups have increased by more than twice as much amongst the most digitally intensive firms, suggesting some role for changing technologies. However, mark ups have also continued to increase in less tech‑intensive sectors, suggesting other dynamics are at play.
The final explanation is that competitive pressures have declined. In more competitive markets, we would expect to see lower productivity firms being more likely to exit the market and less likely to take on staff than high productivity firms. We can test this by looking at how strong these competitive dynamics are in industries which have had larger increases in mark‑ups over time. The Australian evidence indeed shows that in industries with higher mark‑ups, these relationships don’t hold as strongly. This further supports the evidence provided by the range of indicators that competitive pressures have declined in Australia since the early 2000s.
6. Conclusion
Over recent decades, there have been a number of significant changes in the Australian economy. The job‑switching rate has fallen. The business start‑up rate has declined. The largest firms have increased their market share. Mark‑ups have increased. All this suggests that the Australian economy has become less competitive.
Might this help explain the productivity slowdown? One back‑of‑the envelope calculation suggests that rising market power has reduced the rate at which labour flows to its most productive use, which has in turn lowered annual labour productivity growth by 0.1 percentage points (about one fifth of the observed slowdown since 2012). There is also evidence that declining competitive pressures are one of the main reasons Australian firms have become slower to adopt, innovate and improve their productivity performance (Andrews et al 2022).
Low productivity growth and declining competition are key long‑term issues facing the Australian economy. More work is needed on this topic from both the public sector and academics to better understand why market power has increased and therefore whether any policies can and should be used to boost competition and productivity growth.
In past decades, competition policy in Australia has been overly influenced by the ‘Chicago School’ approach, which took a relatively relaxed attitude to market dominance (Triggs and Leigh 2019). Chicago School adherents such as Robert Bork argued that if a firm tried to overcharge, competitors would take its market share. Predatory pricing would not occur because firms could never recoup their losses, as new competitors entered the market. Big could be beautiful.
In recent decades, a new approach has emerged. The ‘New Brandeis Movement’ holds that excessive market concentration can harm consumers and dampen dynamism. Too much market concentration, it argues, can lead to a less innovative and more sluggish economy.
Last month, I travelled to Washington DC to meet with some of the key policymakers who epitomise this movement. Senator Amy Klobuchar, author of Antitrust: Taking on Monopoly Power from the Gilded Age to the Digital Age, is pushing in the Senate for a bill that would bar technology platforms from prioritising their own services over their rivals’ services. Lina Khan, author of ‘Amazon's Antitrust Paradox’, heads the Federal Trade Commission, which is targeting acquisitions by digital platforms. Tim Wu, author of The Curse of Bigness, helped President Biden draft an Executive Order on a whole‑of‑government effort to promote competition in the American economy.
Australia should not ignore this marked shift in the way that senior US officials are regarding competition policy. This is all the more so given the evidence that our economy has seen a fall in the startup rate, a rise in market concentration, and a rise in markups. Competition policy should be one of the factors that we consider when implementing regulation, given regulatory costs for new businesses are larger relative to their size. Linking workers with new jobs faster will also encourage competition and dynamism, which we recognise through our Jobs and Skills Summit and the white paper that will follow.
We also help competition when we encourage investors to back productive new opportunities instead of parking wealth in existing assets. Lowering financing frictions will allow funding to flow to new and innovative firms, which in turn will challenge incumbents.
A range of important reviews may provide insights into how to tackle Australia’s competition problem. Later this year, the Australian Competition and Consumer Commission will hand down its digital platforms inquiry, which will likely address some of the competition issues in the sector. Next year, the independent Productivity Commission will hand down its five‑yearly productivity review. Again, I trust that market dynamism and competition will receive serious consideration in the Productivity Commission’s analysis of the problem and suggested solutions. And in the next couple of years, Treasury is expected to deliver an updated Intergenerational report. Lower productivity projections will hopefully focus attention on the need for a more dynamic economy.
Nicholas Gruen said of his father that Fred Gruen ‘liked the idea of economics because he was an idealist’. After a childhood shaped by the despair of the depression and the horror of war, he believed that economics could help shape a better world. Fred combined rigorous policy analysis with a deep sense of altruism. 101 years after Fred Gruen’s birth, it remains a pretty good mantra for reformers everywhere.
BLADE disclaimer notice
The results of these studies are based, in part, on Australian Business Registrar (ABR) data supplied by the Registrar to the ABS under A New Tax System (Australian Business Number) Act 1999 and tax data supplied by the ATO to the ABS under the Taxation Administration Act 1953. These require that such data is only used for the purpose of carrying out functions of the ABS. No individual information collected under the Census and Statistics Act 1905 is provided back to the Registrar or ATO for administrative or regulatory purposes. Any discussion of data limitations or weaknesses is in the context of using the data for statistical purposes, and is not related to the ability of the data to support the ABR or ATO’s core operational requirements.
Legislative requirements to ensure privacy and secrecy of these data have been followed. Source data are de‑identified and so data about specific individuals or firms has not been viewed in conducting this analysis. In accordance with the Census and Statistics Act 1905, results have been treated where necessary to ensure that they are not likely to enable identification of a particular person or organisation.
References
Andrews, Dan, Jonathan Hambur, David Hansell and Angus Wheeler (2022), ‘Reaching for the Stars: Australian Firms and the Global Productivity Frontier’, Treasury Working Paper.
Andrews, Dan and David Hansell (2019), ‘Productivity‑Enhancing Labour Reallocation in Australia’, Treasury Working Paper.
Autor, David, David Dorn, Lawrence Katz, Chistina Patterson and Jogn Van Reenen (2020) ‘The Fall of the Labor Share and the Rise of Superstar firms’, The Quarterly Journal of Economics 135(2), pp. 645‑709.
Basu, Susanto (2019). Are price‑cost markups rising in the United States? A discussion of the evidence. Journal of Economic Perspectives, 33(3), 3‑22.
De Loecker, Jan, Jan Eeckhout and Gabriel Unger (2020) ‘The Rise of Market Power and the Macroeconomic Implications’, The Quarterly Journal of Economics 135(2), pp. 561‑644.
Hambur, Jonathan (2021) ‘Product Market Power and its Implications for the Australian Economy’, Treasury Working Paper.
Khan, Lina (2017) ‘Amazon's Antitrust Paradox’, The Yale Law Journal 126(3), pp. 564‑907.
Kouvavas, Omiros, Chiara Osbat, Timo Reinelt, and Isabel Vansteenkiste. (2021) ‘Markups and inflation cyclicality in the euro area.’ ECB Working Paper Series No 2617, European Central Bank, Frankfurt.
Leigh, Andrew and Adam Triggs (2016) ‘Markets, Monopolies and Moguls: The Relationship between Inequality and Competition’, The Australian Economic Review 49(4), pp. 389‑412.
Leigh, Andrew and Adam Triggs (2021) ‘Common Ownership of Competing Firms: Evidence from Australia’, IZA Institute of Labor Economics No. 14287.
Triggs, Adam and Leigh, Andrew (2019). ‘A giant problem: The influence of the Chicago School on Australian competition law, economic dynamism and inequality’. Federal Law Review, 47(4), pp. 696‑714.
[*] My thanks to the officials in Treasury’s Structural Analysis Branch for invaluable assistance in preparing these remarks.