
Introduction
I acknowledge the Ngunnawal people, Traditional Custodians of the land on which we gather today, pay my respects to their Elders past and present, and commit myself to the full implementation of the Uluru Statement from the Heart.
It is my pleasure to be invited to talk at the Australian Population Association's 2022 Conference, and an honour to be giving the W.D. Borrie Lecture.
Born in New Zealand in 1913, Wilfred David ‘Mick’ Borrie was at the vanguard of population studies in the 1950s. At a time when Australia’s post‑war migration was booming, it made sense for the nation to be studying demography.
In 1952, four years after Borrie joined the Australian National University’s demography group, it was formally designated as a department. This made it the first demography department in the world. Five years later, Borrie was promoted to chair. That made him the world’s first Professor of Demography (Foster and Varghese 2009).
Borrie was prodigious, authoring or co‑authoring 15 books and 163 articles or reports (Price 2000). When I joined the Research School of Social Sciences in 2004, a quarter century after Borrie’s retirement, his spirit remained strong in the demography department.
Demographers held regular seminars in the Borrie Seminar Room, a location guaranteed to produce spirited engagement from the attendees. Due to the uniquely complicated layout of the Coombs Building, it was all but off‑limits to outsiders. When occasionally a non‑Coombs dweller stumbled into a seminar, they invariably bore the expression of someone who has just found their way through an especially complicated hedge maze.
I learned a great deal from demography colleagues in the Research School of Social Sciences, including doyens of the discipline Peter McDonald, Ann Evans, Terry Hull and Edith Gray.
It has been said that demography tells the story of our lives and the last few years have been quite a story.
Today I will analyse COVID mortality, and in particular how the health burden of the pandemic has fallen hardest on the most disadvantaged people in the Australian community.
Provisional Mortality Statistics
It is possible to undertake this analysis only because of new data collection efforts and fresh research that has been built off these data.
More timely data in recent years has helped Australians see what has been happening during the pandemic.
And this in turn has allowed policy makers to respond in an informed way, faster than ever before.
The agility of the Australian Bureau of Statistics (ABS) has greatly aided this effort.
Provisional Mortality Statistics were first released on 24 June 2020 to account for the first 3 months of the pandemic, and continued to be produced each month thereafter as a way of tracking mortality through the COVID pandemic.
Specifically, the report aimed to identify deaths due to COVID and non‑COVID causes – recognising that the disruption of the pandemic could potentially impact mortality in unexpected ways.
Legislation in Australia mandates that a death can only be registered after a burial or cremation has occurred, hence there can be a delay in the ABS receiving death registrations.
To minimise these delays, the ABS’s Preliminary Mortality reports initially produced information on doctor‑certified deaths only, which are finalised more quickly than coroner‑certified deaths.
The benefit of producing information on doctor‑certified deaths was that detailed cause of death information for a range of causes could be produced. Cause‑of‑death information can indicate if non‑direct effects of the pandemic such as access to healthcare have an impact on mortality.
As the pandemic progressed, questions arose around mortality regarding mental health, suicide, substance use and risk‑taking behaviours – all deaths that are more likely to be certified by a coroner.
While causes of death for a coroner‑certified death are not available quickly, the decision was made to include coroner‑certified deaths at the ‘all cause’ level into the publication from April this year. This has then allowed for any changes in coroner‑certified deaths to be tracked at a broad level, providing early indications into the patterns of deaths that may be considered preventable.
The ABS also introduced reports specifically on COVID mortality in Australia, which provide provisional detail about COVID mortality and how it has been distributed across Australian population groups.
COVID Mortality
The ABS COVID Mortality in Australia publication gives us an insight into what happened in the first 2 years of the pandemic (ABS 2022a, 2022b, 2022c) (Figure 1).
Figure 1. Weekly COVID Mortality in Australia
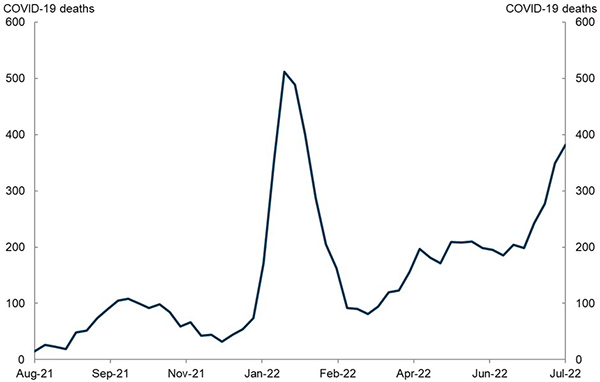
Source: Australian Bureau of Statistics.
In 2020 there were 906 deaths due to COVID, most of which occurred in Victoria during the first 2 waves of the pandemic.
In 2021 there were 1,345 COVID deaths, with the majority occurring in New South Wales and Victoria during the Delta wave.
Figure 2. COVID Mortality – International Comparison
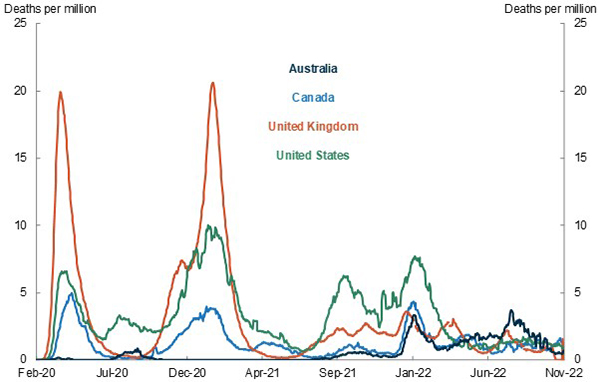
Source: Johns Hopkins University.
Note: Daily new COVID deaths per million people, 7 day rolling average.
As you can see from Figure 2, COVID mortality remained very low in Australia compared to other countries (Johns Hopkins 2022).
On a technical note, I should say that these data from Johns Hopkins University are measured on a different basis to official ABS statistics, as well as being different across countries.
The United Kingdom and United States suffered significant losses of life.
Using this Johns Hopkins data, across 2020 and 2021 combined, Australia suffered 86 deaths per million people.
In the UK and US there were around 2,500 deaths per million people, around 30 times as high as experienced in Australia.
Estimates of global excess deaths tell a grimmer story. Excess deaths are the number of observed deaths above or below the number of deaths that would otherwise have been expected in a given time period.
During 2020 and 2021, excess deaths have been estimated at a staggering 15 million worldwide (WHO 2021). The largest proportion of excess deaths is estimated to have occurred in lower‑middle income countries, such as India, Egypt and Indonesia. Even this is likely to be a significant underestimate, with data on deaths in 41 of 54 countries in Africa not sufficiently reliable to prepare estimates.
Remarkably, Australia went in the opposite direction. As Philip Clarke and I documented in a recent paper published in BMJ Global Health, the mortality rate in Australia was 5.9 per cent lower in 2020‑2021 than in 2015‑2019 (Clarke and Leigh 2022). Contrary to the claims of those who suggested that lockdowns would increase the death rate, we find that lockdowns and social distancing reduced short‑term mortality.
As you might expect, we observe a reduction in mortality from infectious diseases. For example, influenza typically claims around 600 Australian lives per year – yet in 2021 it claimed fewer than 5 lives. However, we also see a reduction in mortality due to non‑infectious causes of death, including cancer and heart attacks. We speculate that this may be because infectious diseases predispose people to other causes of death, but it is also possible that working from home had a positive health effect. Our research contributes to the global discussion around the short‑term health effects of lockdowns. It would not have been possible without the ABS’s publication of Preliminary Mortality statistics.
In 2022, COVID infection rates and mortality in Australia climbed considerably. In the first 9 months of 2022, COVID accounted for 8,028 doctor‑certified deaths.
Across all waves of the pandemic, deaths from COVID were highest among those aged 80‑89 years.
- The median age of those who died from COVID was 87.4 years for females and 83.6 years for males.
- Males had a higher number of registered COVID deaths than females. For every 100 female COVID deaths, there were 126 male COVID deaths.
- Around three‑quarters of all COVID deaths occurred in Victoria and New South Wales.
- Deaths due to COVID were more prevalent in areas with greater socio‑economic disadvantage.
In 2022, unlike 2020 and 2021, Australia had a similar COVID‑19 death rate to other advanced countries. However, Australian death rates remain well below the peaks seen in other countries in the early parts of the pandemic.
Using Johns Hopkins data on COVID deaths, from 1 January to 4 November 2022, there were more than 500 deaths per million Australians.
This was a little higher than in Canada and the UK, which saw 441 and 476 deaths per million people respectively. It’s lower than the US, which saw 732 deaths per million people over the same period.
By now, a great many Australians have been touched by COVID.
There have been more than 10 million confirmed cases of COVID, and because reporting of rapid antigen tests is no longer mandatory, it is likely that a majority of Australians have contracted the disease.
According to official ABS statistics, there have been 10,279 deaths from COVID since the start of the pandemic until 30 September 2022. These are people whose underlying cause of death was COVID.
A few additional points on COVID mortality. In addition to deaths from COVID, the ABS also classifies 2,266 deaths as COVID related. These are people who died from other causes (such as cancer) but for whom COVID contributed to their death. Including these deaths brings deaths from or with COVID to 12,545. Another key data source is the National Notifiable Diseases Surveillance System. According to this dataset, there were 14,718 deaths associated with COVID from the start of the pandemic until 30 September 2022. Statistics derived from surveillance systems are not directly comparable with figures from the ABS.
Inequality in COVID Mortality in Australia
One of the harshest impacts of economic inequality is the differences in health outcomes across socio‑economic groups. In terms of life expectancy, we know that those in the highest income quintile live six years longer than those in the lowest income quintile (Clarke and Leigh 2011).
Health gaps show up in other areas too. The 2017‑18 National Study of Adult Oral Health allows us to compare dental outcomes for low‑income Australians (with a household income below $40,000) and high‑income Australians (with a household income above $100,000). In the richest households, 0.5 per cent of adults are missing all their teeth. In the poorest households, 10.3 per cent of adults are missing all their teeth (Peres and Lalloo 2020). Among dentate respondents, the average number of missing teeth is 4.4 in richer households and 8.0 in poorer households. These are gaps that show with every smile.
Yet in general, too little is known about the distribution of health burdens across the population. In the case of the mortality study referenced above, we used a longitudinal study (the Household Income and Labour Dynamics in Australia survey, or HILDA), and matched it with deaths data. This allowed us to identify those who had died, and study their last reported survey responses to questions about income.
More typically, studies of socio‑economic differences in mortality do not have this kind of information about the deceased. Instead, they focus on the average income in the geographic area where the deceased last resided. This can be informative – though as our research shows, area‑level metrics are no longer statistically significant after controlling for individual‑level metrics (Clarke and Leigh 2011).
In the case of COVID deaths, the available data presently only allows us to look at regional average incomes. It is useful to explore these patterns, but also worth bearing in mind that the true socio‑economic gaps – if we could measure individual incomes – are likely larger still.
Table 1. Socioeconomic status of Australians who died from COVID
| SEIFA Quintile | Male deaths due to COVID-19 |
Quintile share (%) |
Female deaths due to COVID-19 |
Quintile share (%) |
|---|---|---|---|---|
| 1 (lowest) | 1,831 | 31.9 | 1,501 | 33 |
| 2 | 1,256 | 21.9 | 1,056 | 23.2 |
| 3 | 1,032 | 18 | 873 | 19.2 |
| 4 | 879 | 15.3 | 646 | 14.2 |
| 5 (highest) | 681 | 11.9 | 432 | 9.5 |
Source: Australian Bureau of Statistics.
Note: Index of relative social disadvantage (SEIFA/IRSD) quintile of those who died from COVID, deaths registered by 30 September 2022.
Table 1 shows COVID deaths by SEIFA quintile.
Socio‑Economic Indexes for Areas (SEIFA) is a product developed by the ABS that ranks areas in Australia according to relative socio‑economic advantage and disadvantage.
The table shows that COVID mortality was higher in areas of greater socio‑economic disadvantage.
The number of people who died due to COVID was over 3 times higher among those living in the most disadvantaged areas when compared to those living in the least disadvantaged areas.
Around one‑third of all deaths from and with COVID (COVID associated deaths) in 2020 to 2022 were in the most disadvantaged quintile, compared to 11 per cent in the least disadvantaged quintile.
Figure 3. COVID mortality by socioeconomic quintile (age‑standardised)
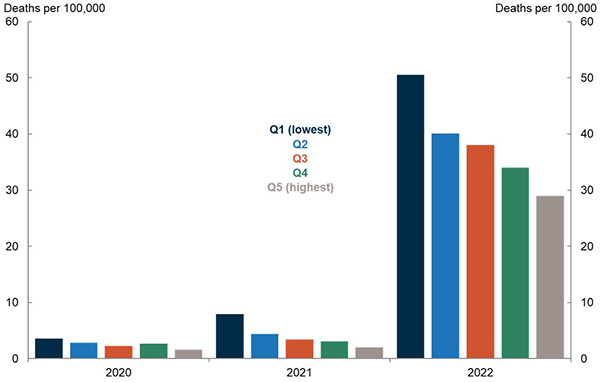
Source: Australian Bureau of Statistics.
Note: COVID associated mortality for deaths registered and received by the ABS until the end of September 2022.
Figure 3 breaks down these patterns over time.
Adjusting for age, COVID death rates were 2.3 times higher in 2020 for the most disadvantaged quintile compared to the least disadvantaged quintile.
In 2021, they were 4 times higher.
In 2022, despite widespread increases in COVID infections, people in the most disadvantaged quintile suffered death rates 1.7 times higher than the least disadvantaged quintile.
I hope that future researchers will be able to shed light on why it is that the largest socio‑economic differences in COVID deaths were in the 2021 Delta wave. It may be relevant that other disparities were also larger. For example, the male‑female mortality gap was bigger in the Delta wave than it was in the Omicron wave or in the two 2020 waves.
Notably, the socioeconomic patterns are not specific to younger or older Australians. In each age group, people in the most disadvantaged SEIFA quintile had a higher chance of dying of COVID.
Let’s turn now to country of birth. Before the pandemic, the mortality of residents born overseas was lower than those born in Australia. This was particularly clear between the ages of 10 and 60.
One likely explanation may be the presence of a selection effect for those moving to Australia, known as the ‘healthy migrant effect’ (Centre for Population and Australia Government Actuary 2021).
However, during the pandemic, Australian residents born overseas have had consistently higher death rates from and with COVID than the Australian‑born population.
Figure 4. COVID mortality by country of birth
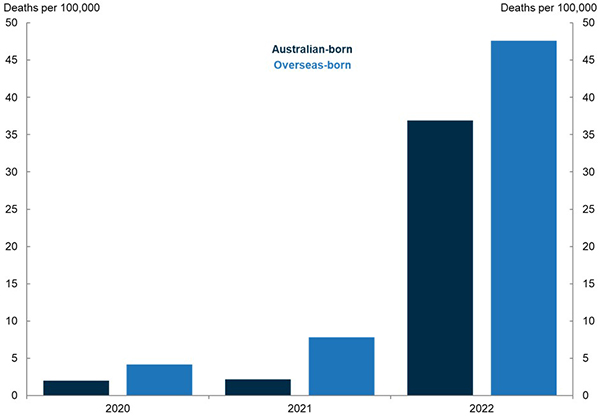
Source: Australian Bureau of Statistics.
Note: COVID associated deaths by place of birth, age‑standardised death rate, deaths registered by 30 September 2022.
Figure 4 shows that in the first year of the pandemic, age‑standardised the COVID death rate for people born overseas were more than twice as high as that for those born in Australia.
In 2021, this gap widened to become 3.6 times higher for those born overseas.
From January to September 2022, the COVID mortality rate for people born overseas was 1.3 times higher than for people born in Australia. Again, the socio‑economic gap in COVID mortality was largest in 2021.
There are also considerable differences among the overseas‑born population. From the beginning of the pandemic until the end of September this year, people born in the Middle East had the highest age‑standardised death rate, at 41 COVID deaths per 100,000 people. This is more than 4 times higher than the rate experienced by those born in Australia.
By contrast, at 9 deaths per 100,000, people born in Sub‑Saharan Africa had a lower age‑standardised COVID death rate than people born in Australia.
First Nations Australians are at heightened risk of more severe outcomes from COVID than non‑First Nations Australians.
There are several reasons for this, including higher rates of socio‑economic disadvantage, higher prevalence of chronic diseases and limited access to culturally safe healthcare.
Figure 5. COVID mortality by indigenous status (includes deaths with and from COVID)
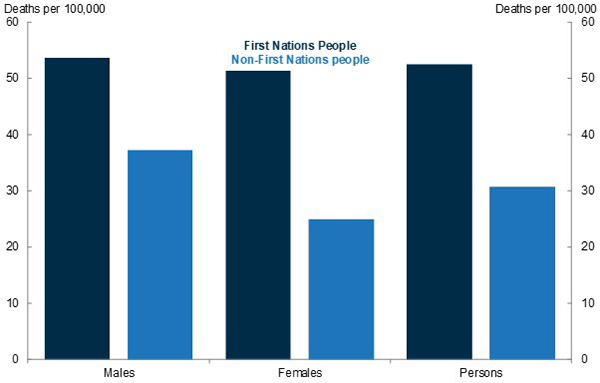
Source: Australian Bureau of Statistics.
Note: Deaths from or with COVID among First Nations people, age‑standardised death rate, deaths registered by 30 September 2022.
Figure 5 shows COVID mortality broken down by Indigenous status. Unlike previous charts, this analysis includes deaths with COVID and deaths from COVID – in other words, it includes deaths where COVID was not the main cause of death. Accordingly, the mortality rates shown in Figure 5 are higher than in previous charts.
The comparison shows that the rate of death from or with COVID for First Nations Australians is 1.7 times higher than for non‑Indigenous Australians.
For deaths with COVID – that is, where COVID was a contributory cause but not the underlying cause – this difference was particularly stark. Among First Nations women, the rate of mortality with COVID is close to 3 times higher than that of non‑Indigenous females. Among First Nations men, the ratio is twice as high.
This difference has emerged later in the pandemic. There were no COVID associated deaths of First Nations people during Wave 1 and Wave 2 of the pandemic. There were 20 deaths during the Delta wave, with the remaining 158 deaths occurring during the Omicron wave.
During the Omicron wave the largest number of deaths have so far been recorded as occurring in February (34), followed by January with 24 deaths. The number of deaths for later months is expected to increase as additional information on deaths is received.
Here are some statistics to give you an idea of how different COVID mortality outcomes are for First Nations Australians.
- A higher proportion of First Nations people died with COVID as a contributing factor compared with non‑Indigenous people (33.1 per cent compared with 22.1 per cent).
- The rate of COVID mortality in First Nations people aged between 55‑64 is 4.5 times higher than non‑Indigenous people of the same age.
- First Nations people who died from COVID had higher rates of diabetes, chronic kidney disease, chronic respiratory diseases and hypertension listed as pre‑existing chronic conditions compared to non‑Indigenous people.
- First Nations people who died from COVID had an average of 3.9 conditions listed on the death certificate. This compares to an average of 3.4 conditions on the death certificate among non‑Indigenous people.
According to the latest Closing the Gap report, the life expectancy gap between First Nations and non‑Indigenous Australians is 8.6 years for males and 7.8 years for females (Closing the Gap Report 2020). The disproportionate mortality impact of COVID on First Nations Australians has served to widen this disparity.
Inequality in COVID Mortality – How Australia Compares
An unequal distribution of COVID mortality is not unique to Australia.
In the US, demographers from the University of California, Berkeley, found that in the first wave, between March and May of 2020, COVID mortality was highest in the most advantaged counties (Dukhovnov and Barbieri 2022). This pattern may reflect the significantly higher spread of the virus in the north‑east parts of the US and in New York in particular.
In contrast, over the second half of 2020 this pattern reversed and then widened, such that COVID mortality rates were 2.6 times higher in the most disadvantaged quintile than in the least. This is close to the Australian figure of 2.3 for the entirety of 2020. Across the entire pandemic, the mortality burden in the United States has fallen most heavily on the most disadvantaged.
In the UK, those born overseas had higher death rates (ONS 2022). During the first wave of the pandemic, people from ethnic minority groups generally had higher rates of death involving COVID compared with the White British population.
The rate of death for the Black African group was 2.7 times greater than the White British group for males, and 2.6 greater for females. This ratio is similar to the difference observed in Australia between overseas‑born and Australian born people during the first 2 years of the pandemic.
In the second COVID wave, British people of Bangladeshi ancestry had the highest rates, 5.0 and 4.5 times greater than for White British males and females respectively.
After adjusting for location – measures of disadvantage, occupation, living arrangements, and pre‑existing health conditions accounted for a large proportion of the excess COVID mortality risk in most ethnic groups.
Although even after accounting for these factors, most Black and South Asian groups remained at higher risk.
In Canada, some neighbourhoods had noticeably higher age‑standardised COVID death rates in 2020 (Subedi and Aitken 2022).
The densely populated urban neighbourhoods, characterised by very high proportions of migrants, lone‑parent families, and low‑income families had significantly higher COVID mortality rates than other neighbourhoods.
Death rates in these neighbourhoods were 2.6 times higher than the neighbourhood type reporting the lowest mortality rates, being low socio‑economic status suburban neighbourhoods.
What might account for these differences? US researchers have hypothesised that mortality rates may be higher among low‑income populations because they are over‑represented in the essential workforce and economic sectors in which it is difficult to work remotely, thereby increasing their exposure to COVID (Dukhovnov and Barbieri 2022). In addition, low‑income people rely more on public transport and are more likely to live in large and multigenerational households.
Conclusion
As we have seen, the mortality impact of the COVID pandemic has been felt unevenly across socio‑economic groups in Australia. This should not have been a surprise, since there were uneven mortality outcomes across socio‑economic groups in Australia well before COVID. Across a range of indicators, it appears that the disparity was worse in 2021 than in 2020 or 2022.
The mortality ratios from COVID in Australia are quite similar to those estimated in other advanced nations. As a share of the population, fewer people died from COVID in Australia than in most other affluent nations. Yet among those who died, the same health inequalities can be seen in Australia as in other advanced countries.
What might have driven the socioeconomic disparities in COVID mortality? And why might many of those disparities have been largest in the Delta wave? As I have noted, disadvantaged people may be less able to work remotely, more reliant on public transport, and more likely to live in crowded households. Uptake of vaccination and antiviral treatments have varied across society as vaccines and treatment became increasingly available. Another factor is that successive COVID waves have had varying degrees of severity. A final factor is that in the years since COVID began, population immunity has steadily risen.
Although geographic‑level measures of inequality have typically been used in research looking at mortality and health outcomes, they are statistically insignificant after controlling for individual‑level measures of socio‑economic status (Clarke and Leigh 2011).
This means that individual‑level measures like household income and educational attainment should be the preferred measure we use in health research. However, this data is not always available, which makes it necessary to look at other measures, such as neighbourhood SEIFA indices.
As the Minister with responsibility for the ABS, I am proud to see it producing the type of data that enables researchers like yourselves (and occasionally myself) to glean novel insights.
The ABS has made great strides in this regard and now provides access to linked datasets such as the Multi‑Agency Data Integration Project (MADIP).
The Australian Government also wants to provide timely data.
The Department of Health and Aged Care has funded the ABS to continue the Provisional Mortality Reports, as well as reports on COVID mortality and excess deaths for this financial year.
Reducing health inequality is a priority for our government, and we are acutely aware of the value of high‑quality research in helping us understand the problem. Only by shining a spotlight onto the health gaps that exist between advantaged and disadvantaged Australians can we begin to develop policies to narrow these disparities.
References
Australian Bureau of Statistics (ABS) (2022a) COVID Mortality in Australia: Deaths registered until 30 September 2022, release date 27 October 2022, Australian Government, accessed November 2022.
Australian Bureau of Statistics (ABS) (2022b) Provisional Mortality Statistics, January – July 2022, release date 27 October 2022, Australian Government, accessed November 2022.
Australian Bureau of Statistics (ABS) (2022c) COVID Mortality by Wave, release date 16 November 2022, accessed November 2022.
Australian Government (2020) Closing the Gap Report 2020.
Australian Institute of Health and Welfare (AIHW) (2022a) Deaths in Australia, last updated 9 June 2022, Australian Government, accessed November 2022.
Australian Institute of Health and Welfare (AIHW) (2022b) Health across socioeconomic groups, release date 7 July 2022, Australian Government, accessed November 2022.
Australian Government Actuary (AGA) and Centre for Population (CPOP) (2021) Sub‑group Mortality: New Insights Using Australian Microdata, accessed November 2022.
Clarke P and Leigh A (2011) Death, Dollars and Degrees: Socio‐economic Status and Longevity in Australia, Economic Papers, vol. 30, issue 3, 348‑355.
Clarke P and Leigh A (2022) Understanding the impact of lockdowns on short‑term excess mortality in Australia, BMJ Global Health, vol. 7, article e009032.
Dukhovnov D and Barbieri M (2022) County‑level socio‑economic disparities in COVID mortality in the USA, International Journal of Epidemiology Vol. 51(2), pp. 418‑428, International Epidemiological Association, accessed November 2022.
Foster S and Varghese M. 2009. The Making of The Australian National University, 1946‑1996. ANU Press, Canberra.
Johns Hopkins University (Johns Hopkins) (2022) Mortality analyses, Coronavirus Resource Centre, last updated 9 November 2022, Johns Hopkins University & Medicine, accessed November 2022.
Office for National Statistics (ONS) (2022) Updating ethnic contrasts in deaths involving the coronavirus (COVID), England: 8 December 2020 to 1 December 2021, release date 26 January 2022, United Kingdom Government, accessed November 2022.
Peres, M and Lalloo R (2020) Tooth loss, denture wearing and implants: Findings from the National Study of Adult Oral Health 2017–18, Australian Dental Journal, Vol 65, Issue S1, S23‑S31.
Price, C.A. (2000) Wilfred David (Mick) Borrie, CBE 1913‑2000. Journal of Population Research 17, v‑vi.
Subedi R and Aitken N (2022) Inequalities in COVID mortality rates by neighbourhood types in Canada, release date 9 May 2022, Statistics Canada, accessed November 2022.
World Health Organization (WHO) (2021), Global excess deaths associated with COVID (modelled estimates), latest update 5 May 2022; first published 20 May 2021, World Health Organization, accessed November 2022.
* My thanks to officials in the Australian Treasury’s Centre for Population for invaluable assistance in preparing this talk.